For anyone overseeing multiple businesses

Every business you oversee, one watch.

Own them, supply them, or just keep an eye on them — Bhairav gives you the view: a consolidated snapshot, forward-looking predictions, and gap analysis, so you can shape strategy instead of just reacting to it.
One view, every business
1×N
one dashboard, however many businesses you're linked to
0
spreadsheets stitched together by hand

Every business keeps running exactly as it does today. Bhairav doesn't touch a thing there — it just watches, and shows you what's happening everywhere at once.

Quick Promo Video
What you get

One view, every business you oversee

Not a replacement for how each business runs day to day — just the oversight layer sitting on top of all of them.

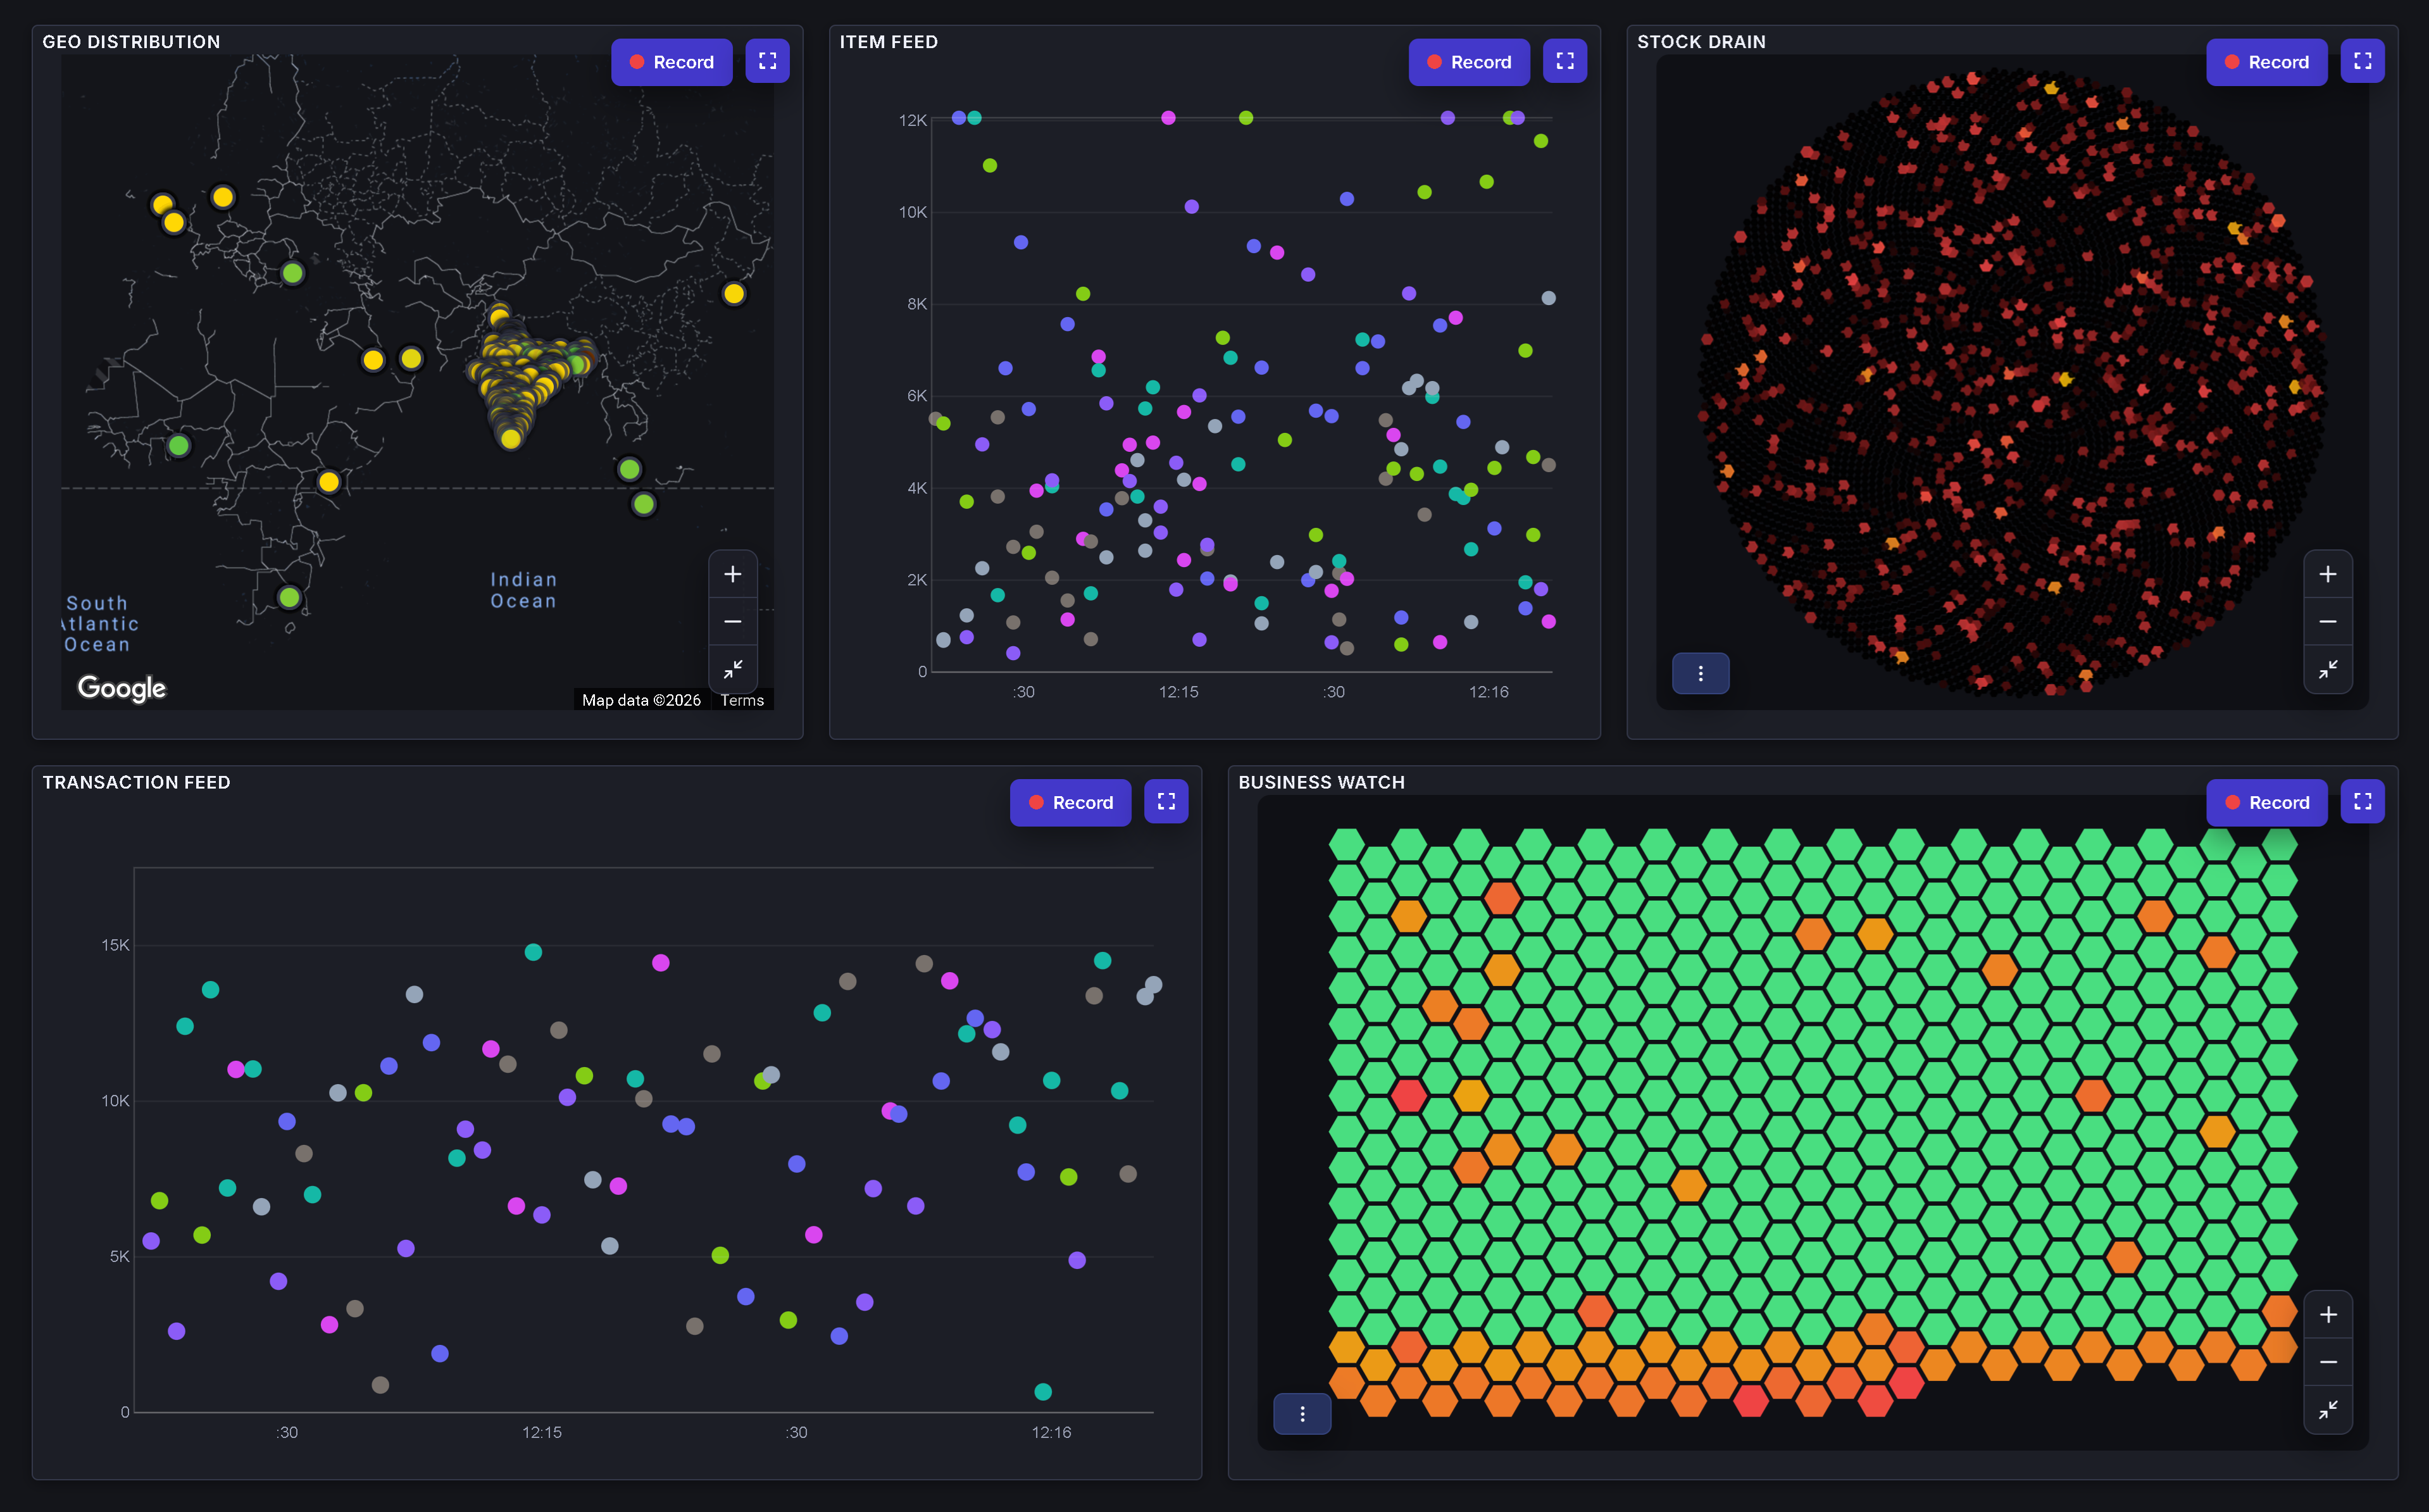
Bhairav dashboard — Geo Distribution, Item Feed, Stock Drain, Transaction Feed, and Business Watch panels
Locations

Watch your locations

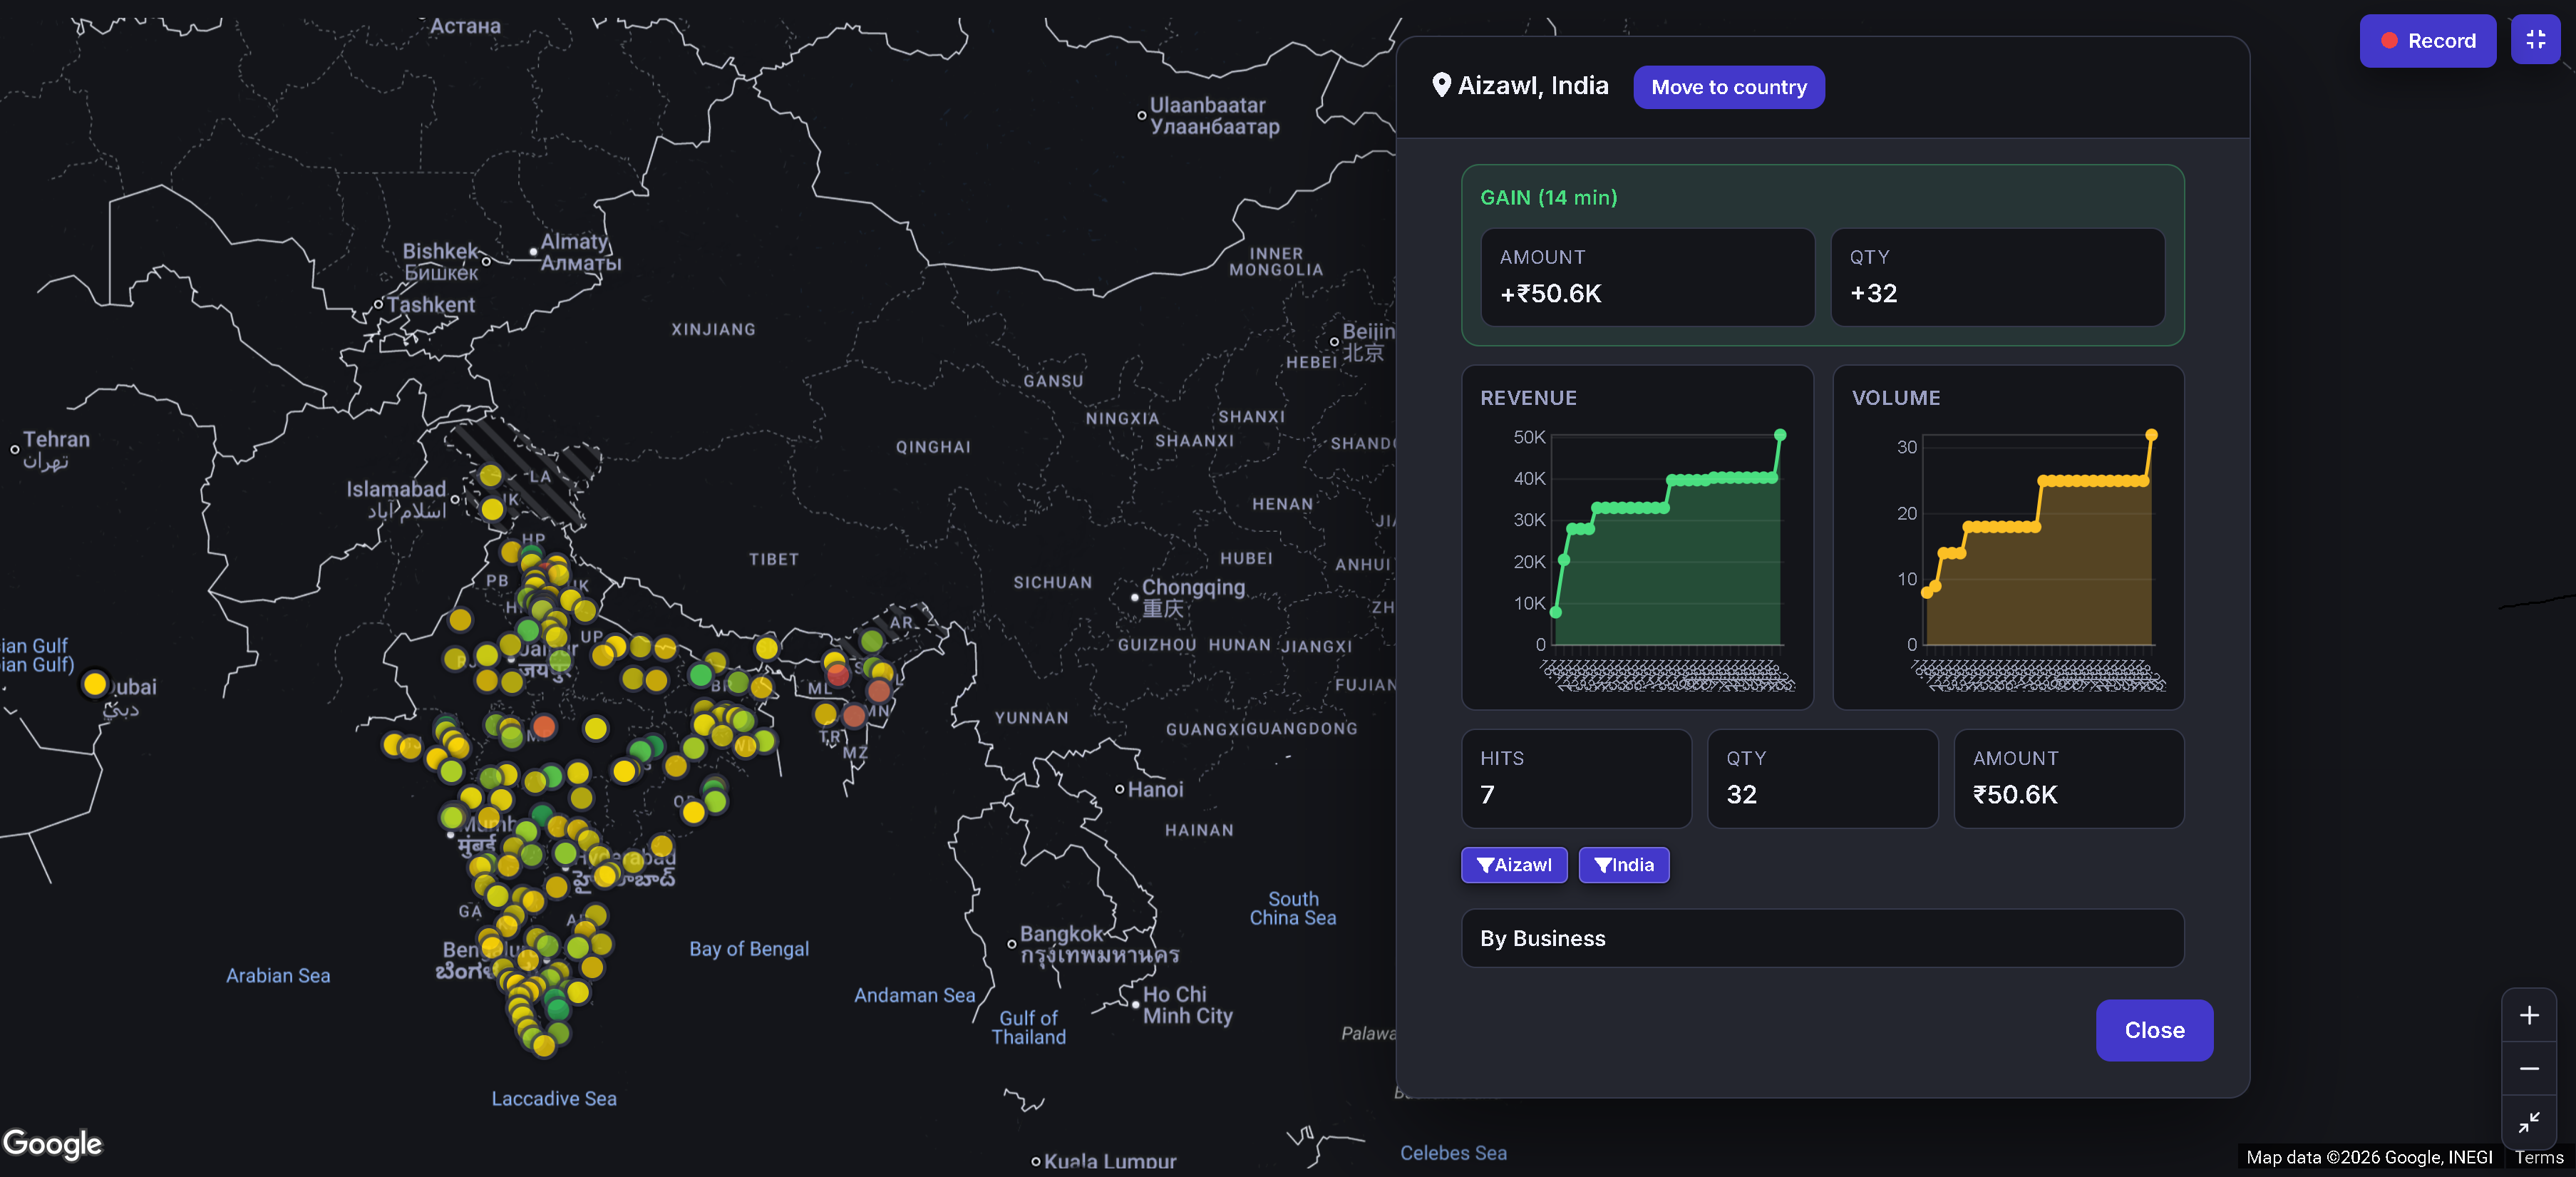
Every business plotted on a live map, colored by how it's trending. Click into any city or region to see its own gain, revenue and volume trend, and drill down to exactly which business is driving the numbers there.

Bhairav geo distribution map with a location detail panel showing gain, revenue, and volume trends
Items

Compare items side by side

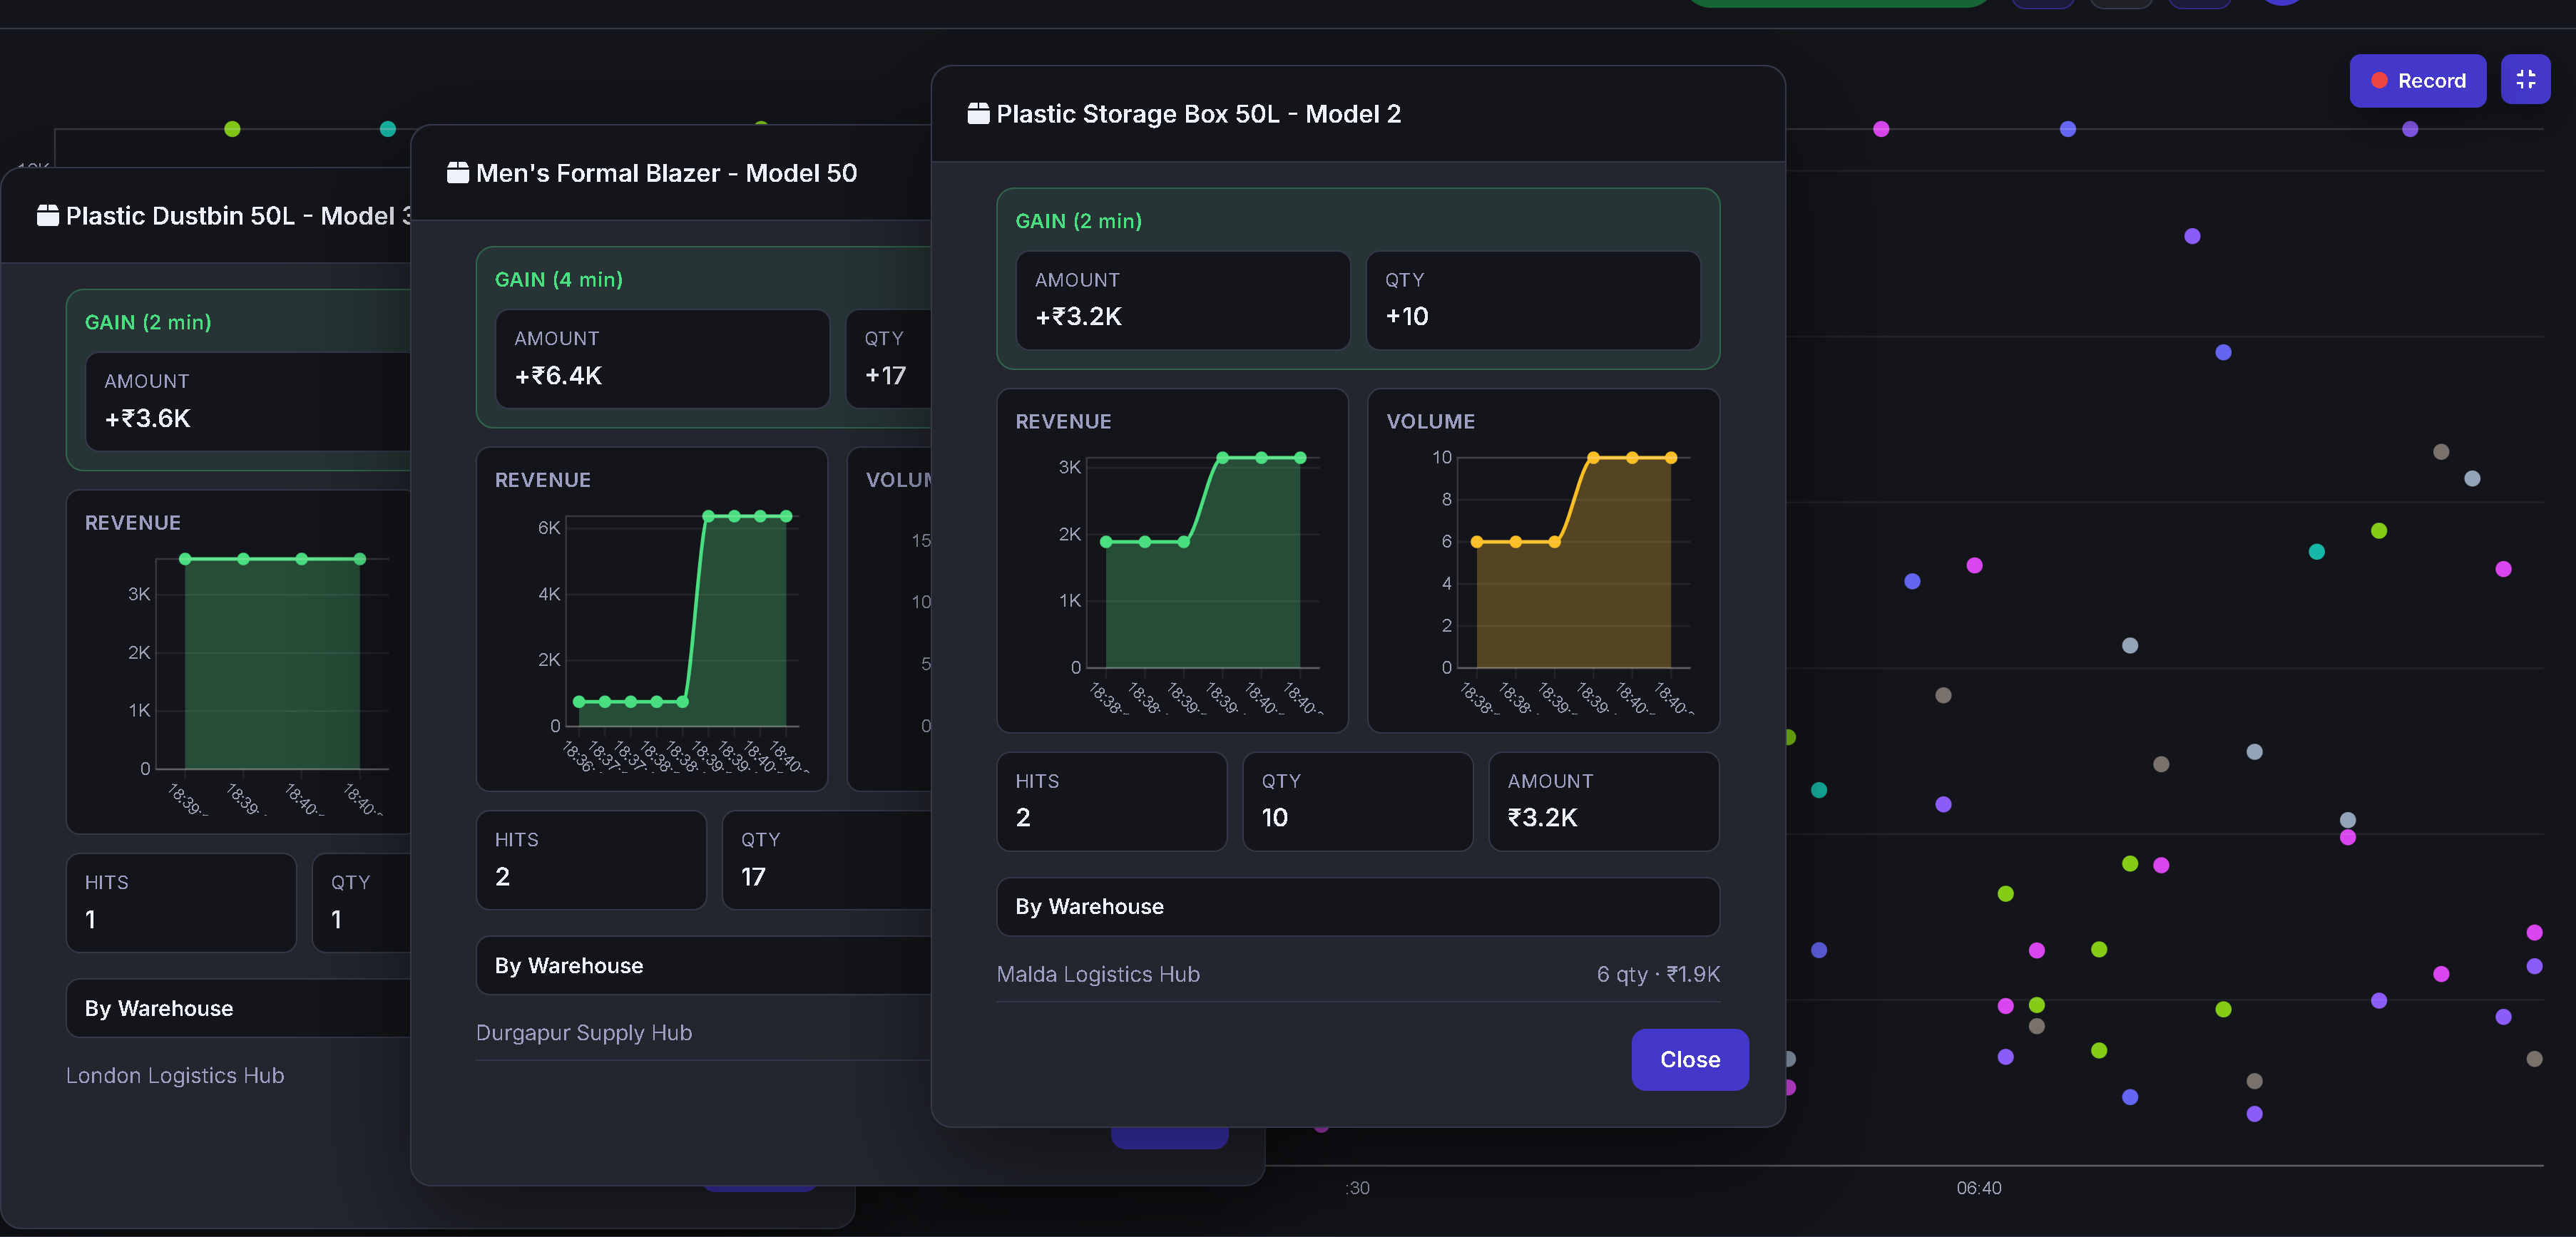
Open more than one item at once and line them up — gain, revenue and volume trend, hits, qty, and which warehouse each one is moving through. No spreadsheet, just the same live panels next to each other.

Bhairav item detail panels for three different items open side by side, each showing gain, revenue, and volume trends
Store metrics

Get your store metrics right

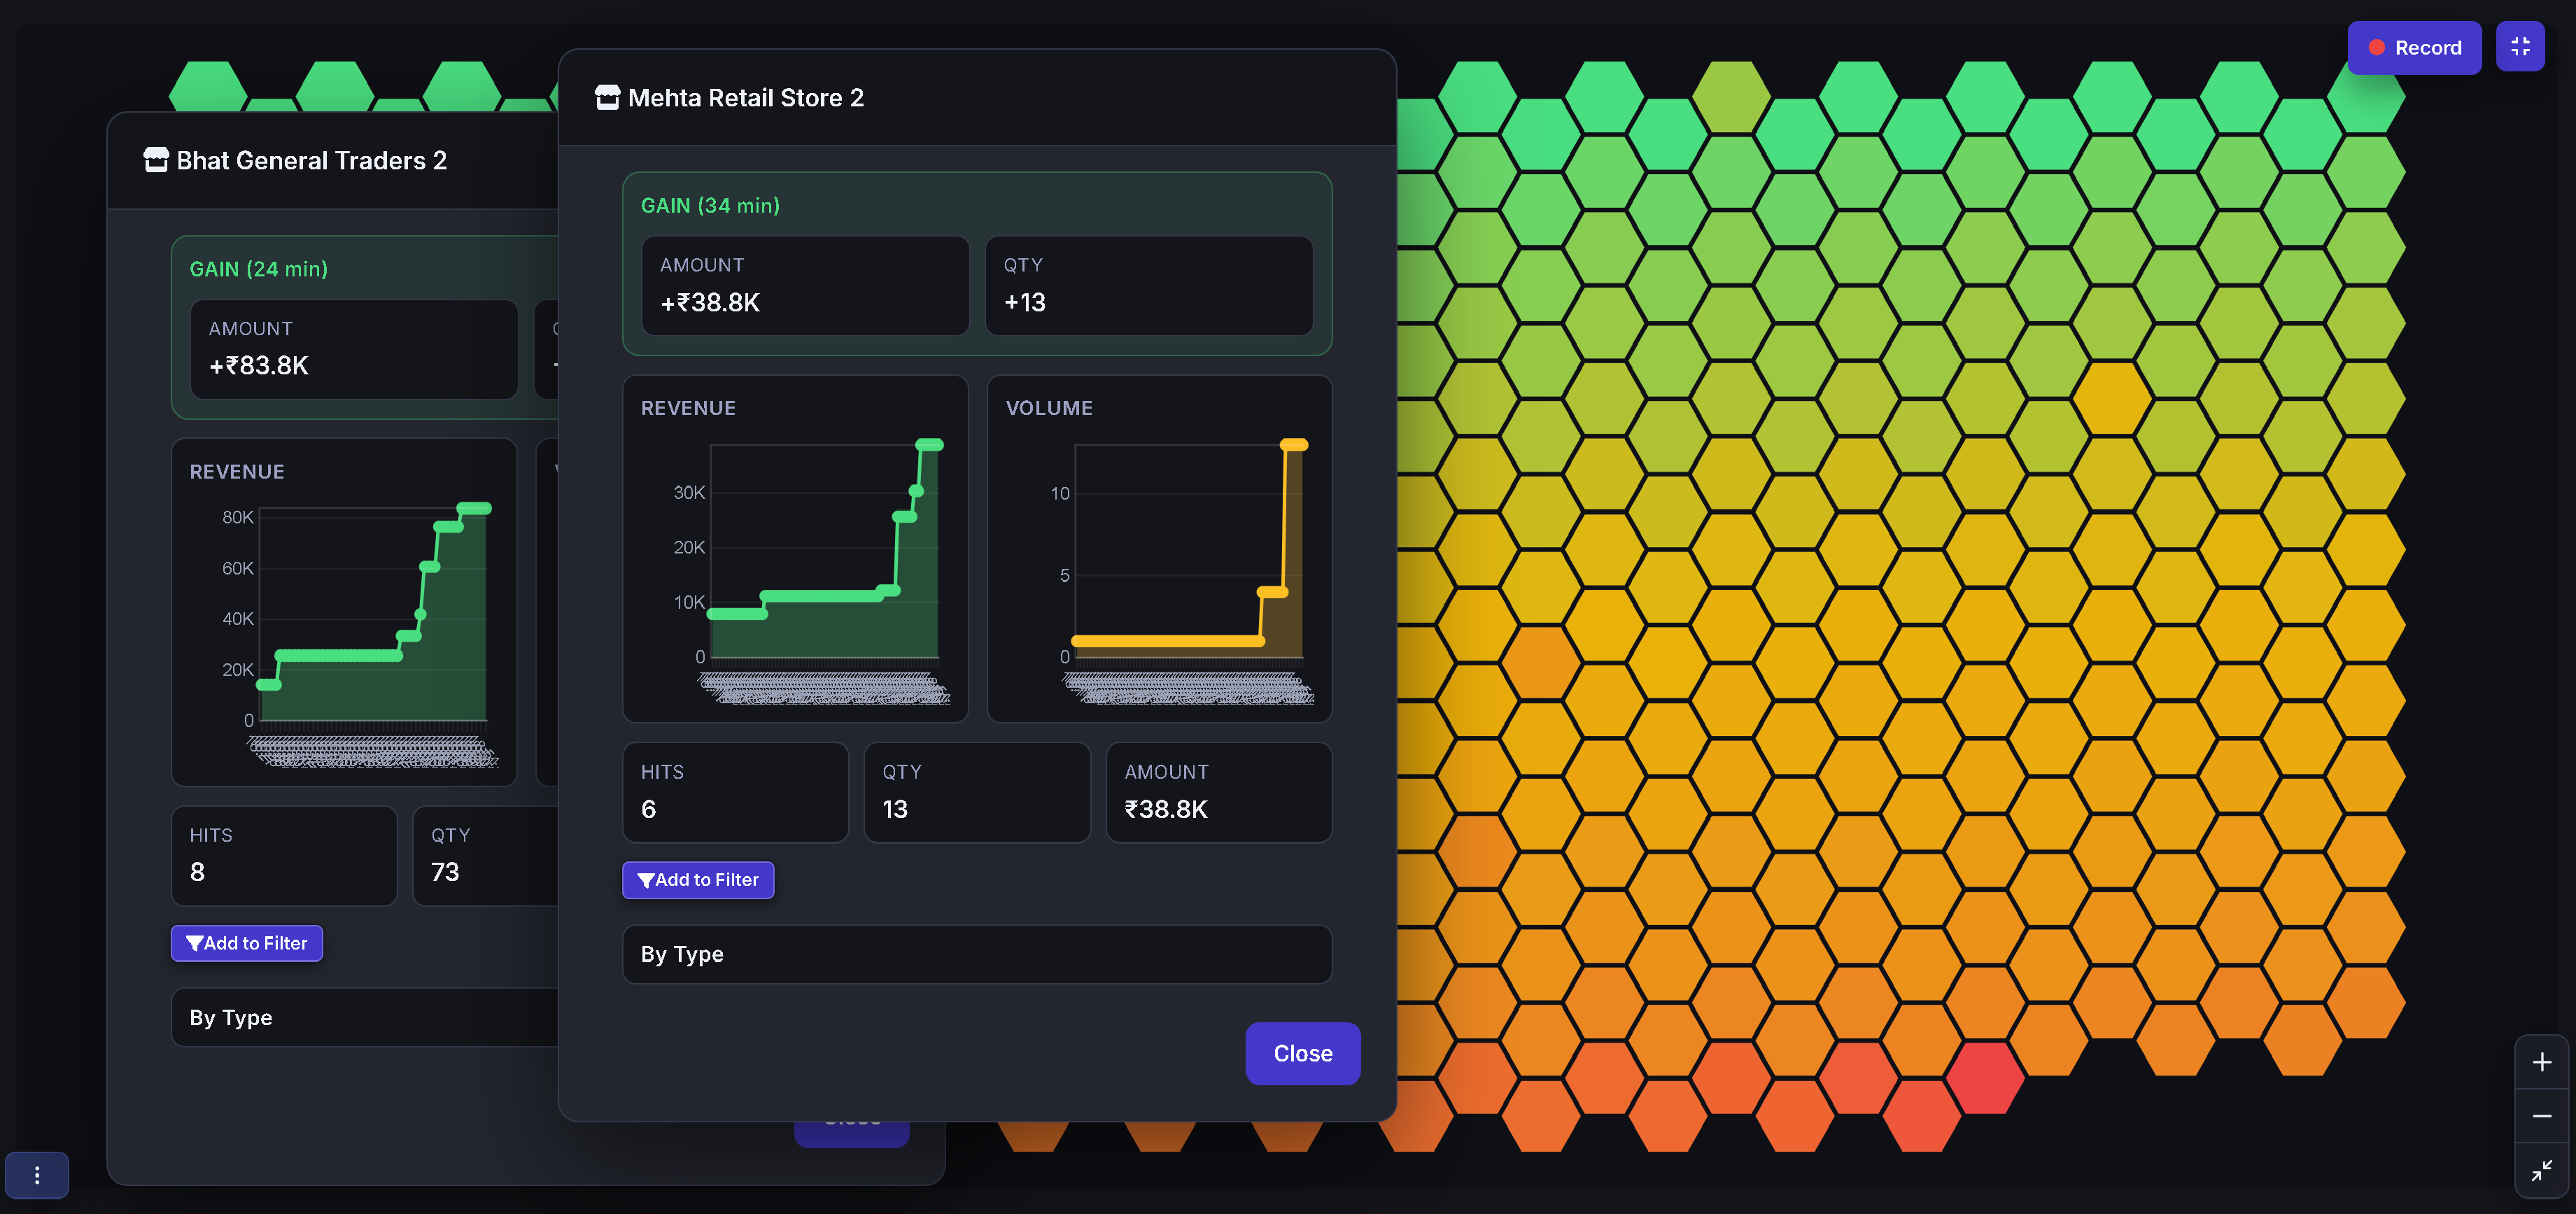
Open any store and see its own gain, revenue and volume trend, hits, qty, and amount — against the same live heatmap the rest of your portfolio is graded on. Add it to a filter and keep watching.

Bhairav business detail panels for two stores open over the Business Watch heatmap, showing gain, revenue, and volume trends
For the businesses you observe

Free software for the businesses you observe

Give the businesses in your rollup something they'll actually want to run — free software that keeps their own records straight, and feeds Bhairav at the same time.

How it works

Three steps to watch

1

Register your Bhairav account

One account for you — not tied to any single business.

2

Onboard each business from any platform

Connect with any software, or upload Excel files — the pipeline merges the information and shows you a live dashboard.

3

Watch everything live

Browse records by type or by business, and check your profitability dashboard whenever you want.

Try it first

See it with demo data before you link a single business

Turn on demo data from Settings and Bhairav fills itself with a handful of sample businesses and realistic-looking records — nothing real, nothing written anywhere, just enough to see how the rollup works.

Demo data

Look around, risk-free

  • Sample businesses with realistic Sales/Purchase/Expense/Payment/Receipt data
  • Full Records and Dashboard views, fully interactive
  • Never touches or creates a real business link
Your real businesses

When you're ready

  • Link each business with its own existing login
  • Unlink any time — nothing about that business changes
  • Turn demo data off and you're back to your real rollup
Pricing

Priced by how many businesses you watch

One flat rate per tier, scaling with the number of businesses linked to your rollup — no per-record or per-user charges.

Stop checking businesses one at a time.

New to Bhairav? Register to get started. Already set up? Sign in and see everything at once.